Triangle Pattern Trading: Master the Power of Chart Patterns
Triangle pattern trading is a strategy that involves identifying and capitalizing on price patterns formed by consolidation within a triangular shape. Traders use this pattern to predict future price movements and plan their trading accordingly.
By understanding the characteristics and behavior of triangle patterns, traders can make informed decisions to enter or exit positions and potentially profit from market volatility. We will explore the various types of triangle patterns, how to identify them, and strategies for trading them effectively.
Whether you are a beginner or an experienced trader, mastering triangle pattern trading can be a valuable tool in your trading arsenal. So let’s dive in and uncover the secrets of this popular trading strategy.
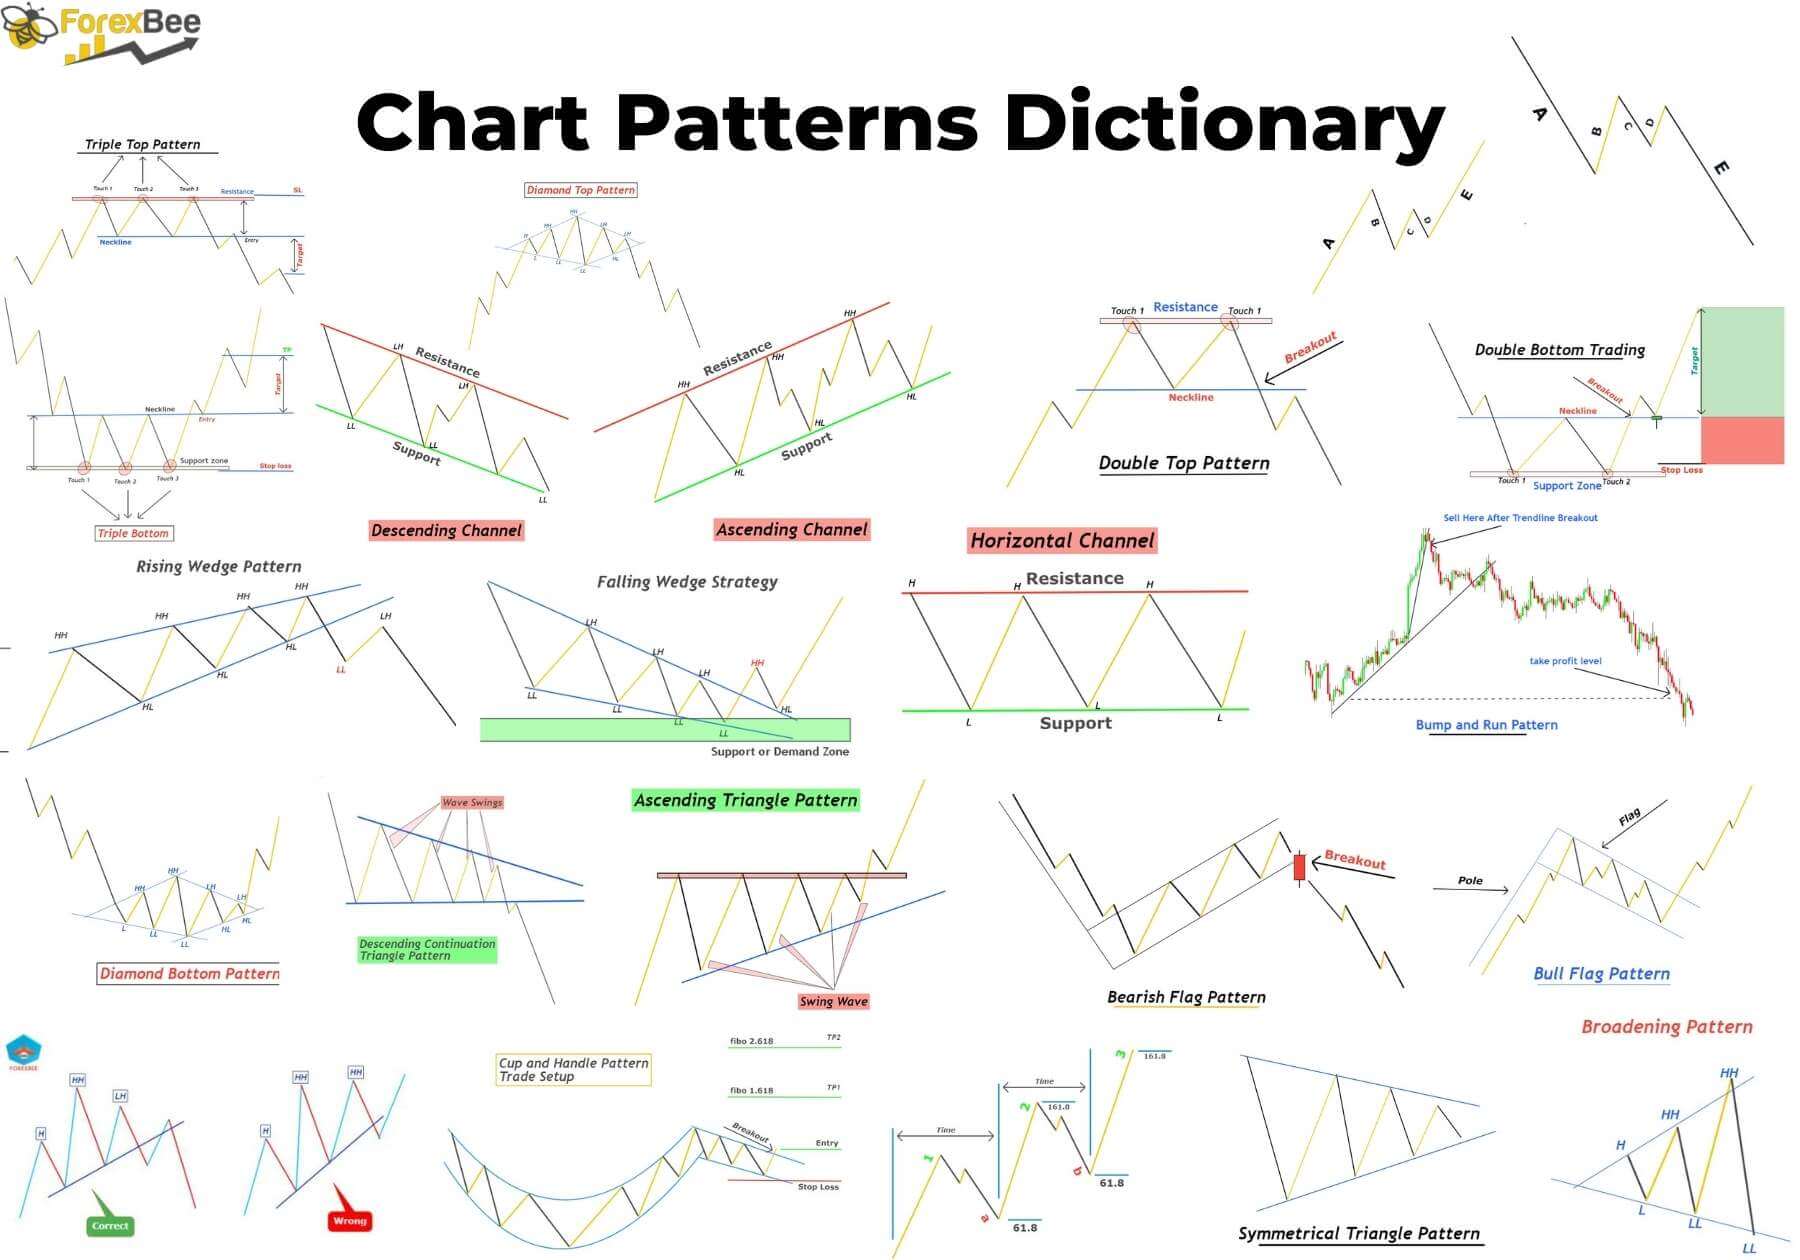
Credit: forexbee.co
Understanding Triangle Patterns
Triangle patterns are powerful technical analysis tools that traders use to identify potential breakouts and trend reversals. These patterns form on price charts and provide valuable insights into market behavior. In this article, we will delve into the world of triangle patterns, exploring their various types and characteristics.
What Is A Triangle Pattern?
A triangle pattern is a chart pattern that shows the consolidation of price within converging trend lines. Traders often refer to this pattern as a continuation pattern, as it typically suggests a temporary pause in the prevailing trend before a breakout occurs. Triangle patterns are formed by connecting a series of higher lows and lower highs, resulting in the formation of a contracting price range.
Types Of Triangle Patterns
There are three main types of triangle patterns: symmetrical triangles, ascending triangles, and descending triangles. Each type has its own unique characteristics and implications for future price movements.
A symmetrical triangle occurs when the lower trend line connects a series of higher lows and the upper trend line connects a series of lower highs. This indicates that buyers and sellers are in balance, causing the price to consolidate. A symmetrical triangle pattern suggests indecision in the market and often precedes a significant breakout in either direction.
An ascending triangle forms when the upper trend line, which connects a series of horizontal highs, is accompanied by an upward-sloping lower trend line. This pattern indicates that buyers are becoming more aggressive and may lead to a bullish breakout. However, it is important to wait for confirmation of the breakout before entering a trade.
A descending triangle is the opposite of an ascending triangle. It is characterized by a downward-sloping upper trend line and a horizontal lower trend line, connecting a series of lows. This pattern signals that sellers are gaining control, and a bearish breakout is likely. As with the ascending triangle, traders should wait for confirmation before initiating a trade.
Characteristics Of Triangle Patterns
Triangle patterns possess several key characteristics that traders can use to identify and interpret these formations:
- Converging trend lines: Triangle patterns are defined by the coming together of two trend lines, forming a triangle shape.
- Decreasing volatility: As price consolidates within the triangle, volatility tends to decrease, indicated by the tightening range.
- Volume: Volume tends to diminish during the formation of a triangle pattern, suggesting a lack of conviction from traders.
- Duration: Triangle patterns can form over varying timeframes, ranging from a few days to several months.
- Breakout direction: The eventual breakout from a triangle pattern can provide clues about the possible direction of the next trend.
Understanding triangle patterns and their characteristics can give traders an edge in interpreting price action and making informed trading decisions. By recognizing these patterns on price charts, traders can potentially identify profitable trading opportunities.
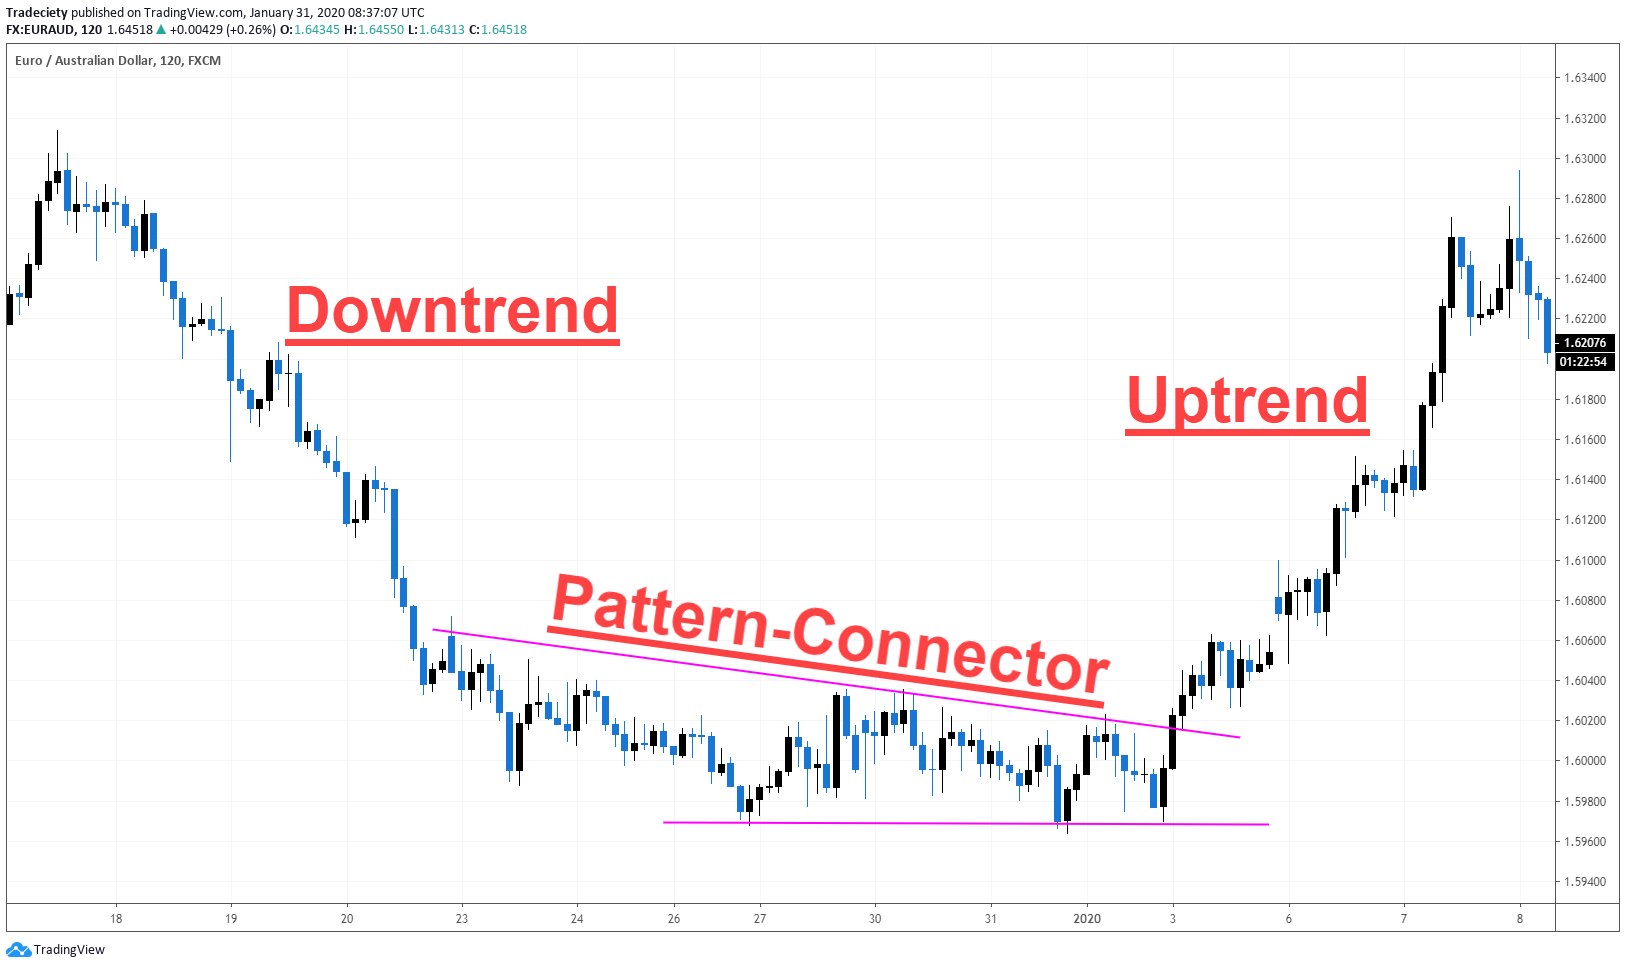
Credit: tradeciety.com
Identifying Triangle Patterns
Triangle patterns are among the most common and reliable chart patterns used in technical analysis. These patterns can provide valuable insights into future price movements, allowing traders to make informed decisions. In this section, we will explore how to recognize triangle patterns on charts and discuss key factors to consider in triangle pattern identification.
Recognizing Triangle Patterns On Charts
Recognizing triangle patterns on charts requires a keen eye for price action and pattern formations. These patterns are characterized by converging trend lines that connect the swing highs and swing lows of price movements. There are three main types of triangle patterns:
- Ascending Triangle: This pattern forms when the upper trend line acts as resistance, while the lower trend line acts as support. The price usually breaks out above the upper trend line, indicating a bullish continuation.
- Descending Triangle: In this pattern, the lower trend line acts as support, while the upper trend line acts as resistance. The price typically breaks out below the lower trend line, signaling a bearish continuation.
- Symmetrical Triangle: Symmetrical triangles have both an upper and lower trend line that converge towards each other. This pattern indicates a period of consolidation before a significant breakout occurs. The direction of the breakout can be bullish or bearish.
When analyzing triangle patterns, it is essential to consider the duration and volume associated with the pattern. Longer duration triangles tend to be more reliable, while higher trading volume during the formation of the pattern confirms its significance.
Key Factors To Consider In Triangle Pattern Identification
Identifying triangle patterns correctly involves considering several key factors:
- Trend Lines: Pay close attention to the slope and alignment of the trend lines. The trend lines should connect at least two swing highs or swing lows to be considered valid.
- Volume: Observe the volume during the formation of the triangle pattern. Higher volume near the breakout point suggests stronger market participation, increasing the reliability of the pattern.
- Pattern Duration: Longer-duration triangles tend to produce more substantial price moves. Look for patterns that have been forming over an extended period, as they are more likely to result in significant breakouts.
- Price Target: Measure the widest part of the triangle pattern and project that distance from the breakout point to estimate a potential price target. This can help you set profit targets or determine your risk-reward ratio.
By focusing on these key factors, traders can enhance their ability to identify triangle patterns accurately. Remember to combine pattern identification with other technical analysis tools to confirm your trading decisions and maximize your profits.
Trading Strategies For Triangle Patterns
Discover effective trading strategies for triangle patterns, a popular chart pattern used by traders to predict price breakouts. Learn how to identify entry and exit points for profitable trades using this versatile technical analysis tool.
Breakout Strategy
A breakout strategy is one of the most common trading strategies used for triangle patterns. This strategy involves entering a trade when the price breaks out of the triangle formation. Traders observe the upper and lower trendlines of the triangle and wait for a decisive breakout above or below these levels.
A breakout above the upper trendline signals a bullish movement, while a breakout below the lower trendline suggests a bearish movement. Traders can take advantage of these breakouts by placing a buy order above the upper trendline or a sell order below the lower trendline.
It’s important to note that breakouts can be false or valid. False breakouts occur when the price briefly moves outside the triangle but quickly turns back within the pattern. To avoid false breakouts, traders often wait for a confirmed breakout with a significant increase in volume.
Pullback Strategy
The pullback strategy is another popular approach used by traders when trading triangle patterns. This strategy involves waiting for a pullback or retracement after a breakout has occurred. Traders look for the price to retest the trendline that was broken during the breakout.
Once the pullback occurs and the price reaches the trendline, traders can enter a trade in the direction of the initial breakout. For example, if the price broke out above the upper trendline, traders can look for a pullback to the same trendline and enter a buy order.
The pullback strategy helps traders to enter the market at a more favorable price after a breakout has already occurred. It increases the likelihood of entering a trade with a higher potential for profit.
Profit Targets And Stop Losses
To manage risk and maximize profits, traders need to set profit targets and stop losses when trading triangle patterns. Profit targets determine the desired level of profit, while stop losses establish the acceptable level of loss.
When setting profit targets, traders often look for levels of previous support or resistance within the pattern. This is because these levels could act as barriers, causing the price to reverse direction. Traders can set profit targets near these levels to secure profits if the price reaches them.
Stop losses are essential to limit potential losses in case the trade goes against the expected direction. Traders typically place stop losses slightly below the breakout level for bullish trades or above the breakout level for bearish trades.
| Strategy | Profit Target | Stop Loss |
|---|---|---|
| Breakout | Above resistance or below support levels | Below breakout level for bullish trades and above breakout level for bearish trades |
| Pullback | Previous support or resistance levels | Below trendline for bullish trades and above trendline for bearish trades |

Credit: tradingstrategyguides.com
Real-life Examples Of Triangle Pattern Trading
Triangle pattern trading is a popular technical analysis strategy used by traders to predict price breakouts and trade reversals. It involves identifying triangular formations on price charts and using them as signals to enter or exit trades. In this section, we will explore two real-life examples of triangle pattern trading: one bullish triangle pattern and one bearish triangle pattern.
Case Study 1: Bullish Triangle Pattern
A bullish triangle pattern indicates a potential upward trend in a stock’s price. Let’s take a look at a real-life example of a bullish triangle pattern:
| Date | Stock | Triangle Pattern Formation | Entry Point | Exit Point | Profit/Loss |
|---|---|---|---|---|---|
| January 15, 2021 | XYZ | A symmetrical triangle pattern formed with higher lows and lower highs. | $50 | $60 | +20% |
In this case, the stock XYZ exhibited a symmetrical triangle pattern, with higher lows and lower highs. Traders who identified this pattern may have entered a long position at $50, expecting a breakout to the upside. The exit point was set at $60, resulting in a profit of 20%. This example shows how triangle pattern trading can be an effective strategy for capturing bullish trends.
Case Study 2: Bearish Triangle Pattern
A bearish triangle pattern indicates a potential downward trend in a stock’s price. Let’s now analyze a real-life example of a bearish triangle pattern:
| Date | Stock | Triangle Pattern Formation | Entry Point | Exit Point | Profit/Loss |
|---|---|---|---|---|---|
| March 10, 2021 | ABC | A descending triangle pattern formed with lower highs and equal lows. | $80 | $70 | +12.5% |
In this case, the stock ABC displayed a descending triangle pattern, characterized by lower highs and equal lows. Traders who recognized this bearish pattern might have entered a short position at $80, anticipating a breakdown to the downside. The exit point was set at $70, yielding a profit of 12.5%. This real-life example highlights how triangle pattern trading can be used to identify and profit from bearish trends.
Frequently Asked Questions Of Triangle Pattern Trading
How Can I Identify A Triangle Pattern In Trading?
To identify a triangle pattern in trading, look for converging trend lines that connect a series of higher lows and lower highs. This pattern indicates a period of consolidation before a potential breakout. Traders often use technical indicators and chart patterns to confirm the presence of a triangle pattern before making trading decisions.
What Are The Different Types Of Triangle Patterns In Trading?
There are three main types of triangle patterns in trading: ascending triangles, descending triangles, and symmetrical triangles. Ascending triangles have a flat top and an upward sloping bottom trend line. Descending triangles have a flat bottom and a downward sloping top trend line.
Symmetrical triangles have both top and bottom trend lines converging towards each other.
How Can I Trade The Triangle Pattern Effectively?
To trade the triangle pattern effectively, traders can wait for a breakout above the upper trend line in an ascending triangle or below the lower trend line in a descending triangle. They can also use indicators like RSI or MACD to confirm the breakout before entering a trade.
It’s important to set appropriate stop-loss levels and take-profit targets to manage risk.
Can Triangle Patterns Be Found In Different Timeframes?
Yes, triangle patterns can be found in various timeframes, from short-term intraday charts to longer-term daily or weekly charts. The duration and significance of the pattern may vary depending on the timeframe. Traders should consider the timeframe they are trading in to determine the strength and reliability of the triangle pattern.
Conclusion
To wrap it up, understanding the triangle pattern trading strategy is essential for any trader looking to gain an edge in the market. By identifying this prominent pattern, traders can anticipate potential breakouts or reversals and make more informed trading decisions.
Remember to analyze the overall market context and use additional technical indicators to confirm your triangle pattern analysis. So, start practicing, and may your trading journey be filled with profitable triangles!
{ “@context”: “https://schema.org”, “@type”: “FAQPage”, “mainEntity”: [ { “@type”: “Question”, “name”: “How can I identify a triangle pattern in trading?”, “acceptedAnswer”: { “@type”: “Answer”, “text”: “To identify a triangle pattern in trading, look for converging trend lines that connect a series of higher lows and lower highs. This pattern indicates a period of consolidation before a potential breakout. Traders often use technical indicators and chart patterns to confirm the presence of a triangle pattern before making trading decisions.” } } , { “@type”: “Question”, “name”: “What are the different types of triangle patterns in trading?”, “acceptedAnswer”: { “@type”: “Answer”, “text”: “There are three main types of triangle patterns in trading: ascending triangles, descending triangles, and symmetrical triangles. Ascending triangles have a flat top and an upward sloping bottom trend line. Descending triangles have a flat bottom and a downward sloping top trend line. Symmetrical triangles have both top and bottom trend lines converging towards each other.” } } , { “@type”: “Question”, “name”: “How can I trade the triangle pattern effectively?”, “acceptedAnswer”: { “@type”: “Answer”, “text”: “To trade the triangle pattern effectively, traders can wait for a breakout above the upper trend line in an ascending triangle or below the lower trend line in a descending triangle. They can also use indicators like RSI or MACD to confirm the breakout before entering a trade. It’s important to set appropriate stop-loss levels and take-profit targets to manage risk.” } } , { “@type”: “Question”, “name”: “Can triangle patterns be found in different timeframes?”, “acceptedAnswer”: { “@type”: “Answer”, “text”: “Yes, triangle patterns can be found in various timeframes, from short-term intraday charts to longer-term daily or weekly charts. The duration and significance of the pattern may vary depending on the timeframe. Traders should consider the timeframe they are trading in to determine the strength and reliability of the triangle pattern.” } } ] }